中文版谷歌中文翻譯(90% 準確率) | English translation
Buy/Sell Your Domains Here。在這裡購買/出售您的域名
Contact Dr. Lu for information about cancer treatments。聯繫盧博士,獲取有關癌症治療資訊。
By EWG Science Team
MARCH 15, 2023
Nearly 75 percent of non-organic fresh produce sold in the U.S. contains residues of potentially harmful pesticides, EWG’s 2023 Shopper’s Guide to Pesticides in Produce™ finds. In this year’s guide, blueberries and green beans join our Dirty Dozen™ list of the 12 fruits and vegetables sampled that have the highest traces of pesticides.
Any exposure to pesticides is a problem, given what we know about several ways they can harm humans. But the findings are particularly concerning for children, who are particularly vulnerable to many of the health harms associated with pesticide exposure.
The Shopper’s Guide represents EWG’s analysis of the latest fruit and vegetable testing data from the Department of Agriculture and Food and Drug Administration. The 2023 guide includes data from 46,569 samples of 46 fruits and vegetables. The USDA peels or scrubs and washes produce samples before testing, whereas the FDA only removes dirt before testing its samples. Even after these steps, the tests still find traces 251 different pesticides.
The guide includes our Dirty Dozen as well as our Clean Fifteen™, which shows which fruits and vegetables tested have very low or no traces of pesticides.
Some of the USDA’s tests show traces of pesticides long since banned by the Environmental Protection Agency. Much stricter federal regulation and oversight of these chemicals is needed.
Consumption of fruit and vegetables, organic or not, is critical to a healthy diet and good health. But for shoppers concerned about dietary pesticide exposure, EWG’s Shopper’s Guide, released every year since 2004, provides information about the fruits and vegetables with the highest and lowest pesticide residues, so consumers can make the best decisions for their families.
For this year’s guide, the overall picture remains problematic: Too many pesticides are still found in too high quantities on too much of the produce millions of Americans eat every day.
Many peer-reviewed scientific studies have shown disturbing links between pesticides and human health issues. These findings raise important questions about the safety of pesticide mixtures found on produce.
Research from Harvard University shows that consuming fruits and vegetables with high levels of pesticide residues may lessen the benefits of fruit and vegetable consumption, including protection against cardiovascular disease and mortality.
A recent EWG investigation published in the peer-reviewed journal Environmental Health found that the EPA has failed to adequately protect children from pesticides. For almost 90 percent of the most common pesticides, the agency has neglected to apply the Food Quality Protection Act–mandated children’s health safety factor to the allowable limits.
The threats pesticides pose to children’s health have been known since at least 1993 – 30 years ago – when the National Academies of Science published a landmark study warning of inadequate oversight. The American Academy of Pediatrics recommends parents concerned about their children’s exposure to pesticides consult EWG’s Shopper’s Guide.
Choosing organic fruits and vegetables can almost immediately reduce the amounts of residues in a person’s body, because the harmful chemicals used on non-organic, or conventional, produce are no longer a factor.
Blueberries and green beans are on the Dirty Dozen this year. Both crops still have troubling concentrations of pesticides that can harm the human nervous system, called organophosphate insecticides, though the levels have decreased over the past decade.
Several green bean samples had residues of acephate, a toxic pesticide, which the EPA banned more than 10 years ago from use on green beans grown for food.
Also this year, cantaloupe was removed from the Clean Fifteen, and carrots were added.
Of the 46 items included in our analysis, these 12 fruits and vegetables were most contaminated with pesticides:
Some highlights from the Dirty Dozen testing:
These 15 items had the lowest amounts of pesticide residues, according to EWG’s analysis of the most recent USDA data.1
Top takeaways for consumers:
* A small amount of sweet corn, papaya and summer squash sold in the United States is produced from genetically modified seeds. Buy organic varieties of these crops if you want to avoid genetically modified produce.
See the full list of all Shopper’s Guide fruits and vegetables.
The Shopper’s Guide combines data from USDA and FDA tests from 2021 and up to 10 years earlier, with the exception of pineapple data, which is from 2002.
The newest data released by the agencies included results of tests of more than 46,000 samples of produce, since it’s impossible to test every single piece of fruit and vegetable sold in the U.S. The USDA does not test every type of produce every year.
The USDA also does not test produce for all pesticides used in crop production. For example, glyphosate is the most heavily used pesticide in the U.S., and it can be found in high levels on several grains and beans, such as oats and chickpeas. But the USDA has not analyzed these crops for glyphosate.
EWG’s methodology involves six measures of pesticide contamination:
With the knowledge that pesticides are known to cause potential health problems, people can use the Shopper’s Guide to reduce their exposure to these chemicals when buying fruit and vegetables. One way to do this is by choosing organic produce.
Standards for growing organic produce ban the use of synthetic pesticides, which is a simple way to identify items likely to have no or minimal traces of those substances. Consumption of organically produced food reduces pesticide exposure and is linked to a variety of health benefits, according to multiple studies, especially findings from a large study in France .2,3
Clinical trials continue to show that people who switch from conventionally grown to organic foods see a rapid and dramatic reduction in their urinary pesticide concentrations, a marker of pesticide exposure.4 Other studies have linked higher consumption of organic foods to lower urinary pesticide levels, improved fertility and birth outcomes, reduced incidence of non-Hodgkin lymphoma, lower BMI and reduced risk of Type 2 diabetes. 2,3,5,6,7
Researchers from Harvard University used USDA test data and methods similar to EWG’s to classify produce as having high or low pesticides. 7 That study’s lists of high- and low-pesticide crops largely overlap with EWG’s Dirty Dozen and Clean Fifteen.
| FERTILITY STUDIES’ CLASSIFICATION OF PESTICIDE RESIDUES | |
|---|---|
| High pesticide residue score | Apples, apple sauce, blueberries, grapes, green beans, leafy greens, pears, peaches, potatoes, plums, spinach, strawberries, raisins, sweet peppers, tomatoes, winter squash |
| Low to moderate pesticide residue score | Apple juice, avocados, bananas, beans, broccoli, cabbage, cantaloupe, carrots, cauliflower, celery, corn, eggplant, grapefruit, lentils, lettuce, onions, orange, orange juice, peas, prunes, summer squash, sweet potatoes, tofu, tomato sauce, zucchini |
The Harvard researchers also found that people who ate greater quantities of crops high in pesticides had higher levels of urinary pesticides and lower fertility.7,8 People who ate a pro-fertility diet, which included the low-pesticide crops, among other foods and nutrients, like whole grains and folic acid, were more likely to have a successful pregnancy.9
These studies don’t definitively show whether the positive effects associated with organic foods are directly and exclusively caused by lower pesticide exposures.
Genetically engineered crops, also known as genetically modified organisms or GMOs, are most commonly found in processed foods rather than in fresh produce.
Corn syrup and corn oil, produced from predominantly GMO starchy field corn, are commonly found in processed foods. But you may find genetically modified zucchini, yellow squash, sweet corn, papaya and apples in U.S. markets, though only papayas are predominantly GMO.
By law, some GMO food products in the U.S. must be labeled as such. But these labels may be difficult to interpret, with confusing terms like “bioengineered.” Consumers who want to avoid GMOs can choose organic zucchini, yellow squash, sweet corn, papaya, apples and potatoes. Processed goods that are certified organic or bear Non-GMO Project Verified labels can also be trusted to be GMO-free.
EWG provides several resources – including EWG’s Shopper’s Guide To Avoiding GMO Food, the Food Scores database and EWG’s Healthy Living app – to help consumers identify foods likely to contain genetically engineered ingredients.
EWG is concerned about pesticides on produce because they are toxic by design, created expressly to kill living organisms – insects, plants and fungi considered “pests.” But many pesticides pose health dangers to people, too, including cancer, hormone disruption, and brain and nervous system toxicity. These hazards have been confirmed by independent scientists and physicians and U.S. and international government agencies.
Most pesticide residues found by USDA and FDA fall below government limits and are legal. But legal limits don’t always represent what’s safe for human consumption.
The conventional agriculture industry, and even the EPA, often claim pesticides are safe right up until the moment they are banned because of overwhelming evidence showing they are toxic to humans. Chlorpyrifos is a great example of this.
And many pesticides still legal for use in the U.S. have been banned in the EU because of the science showing threats to human health and wildlife. Four toxic neonicotinoids – imidacloprid, thiamethoxam, clothianidin and dinotefuran – remain legal for use here, even though the EPA has acknowledged their danger to insects like honeybees.
EWG is a strong advocate for strengthening our federal pesticide regulations. The EPA’s safety levels, called “tolerances,” help agency regulators determine whether farmers are applying pesticides properly. If tolerance levels were set to protect all children eating produce, as we believe they should be, more fruits and vegetables would fail.
We also urge the USDA and the FDA to more regularly test all commodities for pesticide residues and ensure they testing for all pesticides commonly used in agriculture. Federal agencies’ pesticide residue monitoring and dietary surveys do not adequately capture the variety of pesticide exposures Americans face.
EWG’s Shopper’s Guide ranks pesticide contamination on 46 popular fruits and vegetables by analyzing 46,569 samples taken by the USDA and the FDA. Each year the USDA selects a subset of these fruits and vegetables to test, rather than testing all crops every year.
To create this guide, EWG uses data from the most recent one-to-two-year sampling period for each food. Since the USDA doesn’t test honeydew melon, EWG uses the FDA’s pesticide monitoring data for this crop.
| FOOD | YEAR | SOURCE |
|---|---|---|
| Apples | 2015-2016 | USDA PDP |
| Asparagus | 2017-2019 | USDA PDP |
| Avocados | 2012 | USDA PDP |
| Bananas | 2019-2020 | USDA PDP |
| Bell and hot peppers | 2019-2021 | USDA PDP |
| Blueberries | 2020-2021 | USDA PDP |
| Broccoli | 2020-2021 | USDA PDP |
| Cabbage | 2017-2019 | USDA PDP |
| Cantaloupe | 2011-2012, 2019 | USDA PDP |
| Carrots | 2020-2021 | USDA PDP |
| Cauliflower | 2019-2021 | USDA PDP |
| Celery | 2014, 2021 | USDA PDP |
| Cherries | 2014-2016 | USDA PDP |
| Cherry tomatoes | 2012 | USDA PDP |
| Cucumbers | 2015-2017 | USDA PDP |
| Eggplant | 2020-2021 | USDA PDP |
| Grapefruit | 2015-2017 | USDA PDP |
| Grapes | 2016 | USDA PDP |
| Green beans | 2020-2021 | USDA PDP |
| Honeydew melon | 2008-2019 | FDA |
| Kale, collard and mustard greens | 2017-2020 | USDA PDP |
| Kiwis | 2018-2020 | FDA |
| Lettuce | 2015-2017 | USDA PDP |
| Mangoes | 2017-2018 | USDA PDP |
| Mushrooms | 2012-2013 | USDA PDP |
| Nectarines | 2014-2015 | USDA PDP |
| Onions | 2017 | USDA PDP |
| Oranges | 2016 | USDA PDP |
| Papaya | 2011-2012 | USDA PDP |
| Peaches | 2015, 2021 | USDA PDP |
| Pears | 2016, 2021 | USDA PDP |
| Pineapple | 2002 | USDA PDP |
| Plums | 2013, 2021 | USDA PDP |
| Potatoes | 2016 | USDA PDP |
| Raspberries | 2013 | USDA PDP |
| Snap peas | 2017-2018 | USDA PDP |
| Spinach | 2016 | USDA PDP |
| Strawberries | 2015-2016 | USDA PDP |
| Summer squash | 2020-2021 | USDA PDP |
| Sweet corn | 2014-2015 | USDA PDP |
| Sweet peas (frozen) | 2018-2019 | USDA PDP |
| Sweet potatoes | 2016-2018 | USDA PDP |
| Tangerines | 2019-2021 | USDA PDP |
| Tomatoes | 2015-2016 | USDA PDP |
| Watermelon | 2015, 2021 | USDA PDP |
| Winter squash | 2020-2021 | USDA PDP |
Before conducting tests, the USDA processes each piece of fruit or vegetable in the same way people tend to do at home. For example, those with inedible peels are peeled, and those with edible peels are rinsed under cold water and drained before they are tested. So the USDA test results are a good indication of consumers’ likely exposure.
Unprocessed produce tends to have higher concentrations of pesticides, as shown by California Department of Pesticide Regulation test results.
To compare foods, EWG considers six measures of pesticide contamination:
Within each of these categories, we ranked the 46 fruits and vegetables and then normalized the ranks on a scale of 1 to 100, with 100 being the highest. For each food, we calculated a total score by summing the normalized rank from each metric. All categories are weighted equally, since they convey different but equally relevant information about pesticide levels on produce.
The USDA test program includes both domestically grown and imported produce, and sometimes ranks differ on the basis of origin. In these cases, we displayed domestic and imported items separately to help consumers select the option with the lowest pesticide levels.
The Shopper’s Guide to Pesticides in Produce full list shows how fruits and vegetables rank based on these total scores.
The Shopper’s Guide does not incorporate risk assessment into the calculations. All pesticides are weighted equally, and we do not factor in the levels deemed acceptable by the EPA. Research constantly provides new insights into the threats pesticides pose to human and environmental health. EWG designed this method to capture this uncertainty and enable consumers to reduce their overall pesticide load.
This article was adapted and updated from the 2021 Shopper’s Guide.
該指南包括我們的 Dirty Dozen 和 Clean Fifteen™,其中顯示了經過測試的水果和蔬菜的農藥殘留量非常低或沒有。
美國農業部的一些測試顯示出農藥的痕跡,這些農藥早已被環境保護局禁止。 需要對這些化學品進行更嚴格的聯邦監管和監督。
消費水果和蔬菜,無論是否有機,對於健康飲食和身體健康至關重要。 但對於擔心膳食農藥暴露的消費者來說,EWG 自 2004 年以來每年發布的《購物者指南》提供了有關農藥殘留最高和最低的水果和蔬菜的信息,以便消費者可以為家人做出最佳決定。
對於今年的指南來說,總體情況仍然存在問題:在數百萬美國人每天食用的太多農產品中,仍然發現了太多、含量過高的農藥。
許多經過同行評審的科學研究表明農藥與人類健康問題之間存在令人不安的聯繫。 這些發現對農產品中農藥混合物的安全性提出了重要問題。
哈佛大學的研究表明,食用農藥殘留量高的水果和蔬菜可能會降低食用水果和蔬菜的益處,包括預防心血管疾病和死亡。
環境工作組最近在同行評審期刊《環境健康》上發表的一項調查發現,美國環保署未能充分保護兒童免受農藥侵害。 對於近 90% 的最常見農藥,該機構忽視了將《食品質量保護法》規定的兒童健康安全因素應用到允許的限度內。
至少從 1993 年(即 30 年前)起,人們就知道農藥對兒童健康構成的威脅,當時美國國家科學院發表了一項具有里程碑意義的研究,警告監管不力。 美國兒科學會建議擔心孩子接觸農藥的父母查閱 EWG 的購物指南。
選擇有機水果和蔬菜幾乎可以立即減少人體內的殘留量,因為非有機或傳統農產品中使用的有害化學物質不再是一個因素。
藍莓和青豆今年躋身“骯髒一打”。 這兩種作物中仍然含有令人不安的農藥,這種農藥被稱為有機磷殺蟲劑,會損害人類神經系統,儘管在過去十年中含量有所下降。
一些綠豆樣品中含有乙酰甲胺磷(一種有毒農藥)殘留,美國環保局十多年前就禁止在食用綠豆上使用這種農藥。
同樣是今年,哈密瓜從“清潔十五”中刪除,並添加了胡蘿蔔。
在我們分析的 46 種物品中,以下 12 種水果和蔬菜受農藥污染最嚴重:
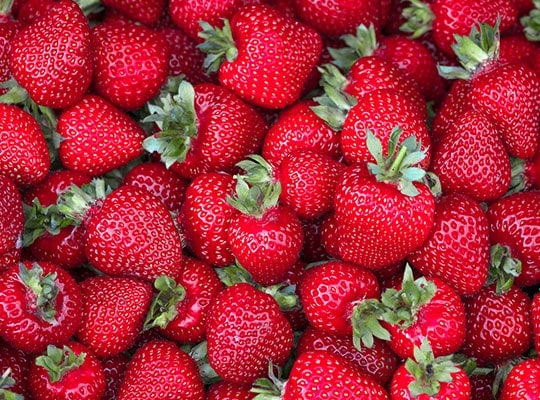
草莓
菠菜
羽衣甘藍、羽衣甘藍和芥菜
桃子
梨
油桃
蘋果
葡萄
貝爾和辣椒
櫻桃
藍莓
綠豆
Dirty Dozen 測試的一些亮點:
超過 90% 的草莓、蘋果、櫻桃、菠菜、油桃和葡萄樣品的兩種或多種農藥殘留檢測呈陽性。
“臟打”物品中總共發現了 210 種農藥。
其中,除櫻桃外,清單上的每種作物都檢測到了 50 多種不同的農藥。
“骯髒一打”中的所有農產品至少有一個樣本含有至少 13 種不同的農藥,有些甚至含有多達 23 種農藥。
羽衣甘藍、羽衣甘藍和芥菜,以及辣椒和甜椒,是檢測出農藥最多的作物,總共分別有 103 種和 101 種農藥。
2011 年禁止在綠豆上使用的神經毒性有機磷殺蟲劑乙酰甲胺磷在 6% 的綠豆樣品中被檢出。
根據 EWG 對美國農業部最新數據的分析,這 15 種產品的農藥殘留量最低。 1
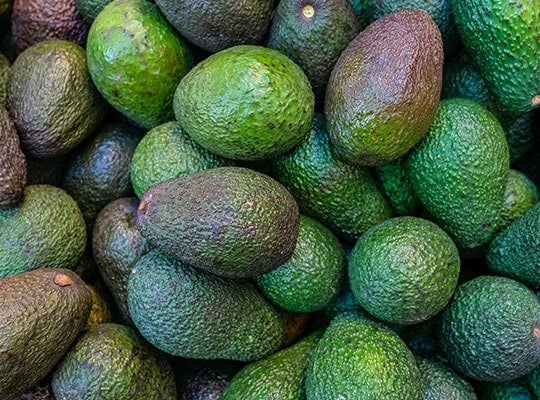
牛油果
甜玉米
菠蘿
洋蔥
木瓜
甜豌豆(冷凍)
蘆筍
哈密瓜
奇異果
捲心菜
蘑菇
芒果
紅薯
西瓜
蘿蔔
消費者的主要收穫:
“清潔十五”水果和蔬菜樣品中近 65% 沒有檢測到農藥殘留。
鱷梨和甜玉米是最乾淨的農產品——不到 2% 的樣品顯示出任何可檢測到的農藥。
超過 10% 的“清潔十五”水果和蔬菜樣品中含有兩種或多種農藥殘留。
“清潔十五”項目的前六項樣本中,沒有檢測出三種以上農藥呈陽性。
查看購物指南中所有水果和蔬菜的完整列表。
《購物指南》綜合了 2021 年和 10 年前美國農業部和 FDA 測試的數據,但菠蘿數據除外,該數據是 2002 年的。
這些機構發布的最新數據包括對超過 46,000 個農產品樣本的測試結果,因為不可能對在美國銷售的每一片水果和蔬菜進行測試。美國農業部不會每年對所有類型的農產品進行測試。
美國農業部也沒有測試農產品中農作物生產中使用的所有農藥。 例如,草甘膦是美國使用最廣泛的農藥,在燕麥和鷹嘴豆等多種穀物和豆類中含量很高。 但美國農業部尚未對這些作物進行草甘膦分析。
EWG 的方法涉及六項農藥污染指標:
使用可檢測農藥進行測試的樣品百分比。
含有兩種或多種可檢測農藥的樣品百分比。
單個樣品中發現的農藥的平均數量。
發現的農藥平均含量,以百萬分之幾為單位。
單個樣品中發現的最大農藥數量。
農作物上發現的農藥總數。
眾所周知,農藥會導致潛在的健康問題,人們可以使用購物指南來減少在購買水果和蔬菜時接觸這些化學物質的機會。 一種方法是選擇有機農產品。
種植有機農產品的標準禁止使用合成農藥,這是識別可能不含有或含有極少量這些物質的物品的簡單方法。 根據多項研究,尤其是法國一項大型研究的結果,食用有機食品可減少農藥接觸,並與多種健康益處相關2,3
臨床試驗繼續表明,從傳統種植食品轉向有機食品的人,其尿中農藥濃度迅速顯著降低,這是農藥暴露的標誌。 4 其他研究表明,有機食品消費量增加與尿中農藥水平降低有關,改善了尿中農藥濃度。 生育能力和出生結果、非霍奇金淋巴瘤發病率降低、體重指數降低以及 2 型糖尿病風險降低。 2,3,5,6,7
哈佛大學的研究人員使用美國農業部的測試數據和類似於 EWG 的方法將農產品分為農藥含量高或低的類別。 7 該研究列出的高農藥和低農藥作物清單與 EWG 的“骯髒的十二種”和“清潔的十五種”作物清單大部分重疊。
農藥殘留分數高 蘋果、蘋果醬、藍莓、葡萄、青豆、綠葉蔬菜、梨、桃子、土豆、李子、菠菜、草莓、葡萄乾、甜椒、西紅柿、冬瓜
低至中度農藥殘留分數 蘋果汁、鱷梨、香蕉、豆類、西蘭花、捲心菜、哈密瓜、胡蘿蔔、花椰菜、芹菜、玉米、茄子、葡萄柚、扁豆、生菜、洋蔥、橙子、橙汁、豌豆、李子、西葫蘆 、紅薯、豆腐、番茄醬、西葫蘆
哈佛大學的研究人員還發現,食用大量農藥含量高的農作物的人尿中農藥含量較高,生育能力也較低。7,8 食用有利於生育的飲食(其中包括低農藥農作物以及其他食物)的人,其生育能力較低。 全穀物和葉酸等營養素更有可能成功懷孕。9
這些研究並沒有明確表明與有機食品相關的積極影響是否直接且完全是由較低的農藥暴露引起的。
基因工程作物,也稱為轉基因生物或轉基因生物,最常見於加工食品而不是新鮮農產品中。
玉米糖漿和玉米油主要由轉基因澱粉玉米製成,常見於加工食品中。 但在美國市場上你可能會發現轉基因西葫蘆、黃南瓜、甜玉米、木瓜和蘋果,儘管只有木瓜主要是轉基因的。
根據法律,美國的一些轉基因食品必須貼上這樣的標籤。 但這些標籤可能很難解釋,其中包括“生物工程”等令人困惑的術語。 想要避免轉基因生物的消費者可以選擇有機西葫蘆、黃南瓜、甜玉米、木瓜、蘋果和土豆。 經過有機認證或帶有非轉基因項目驗證標籤的加工產品也可以相信是非轉基因產品。
EWG 提供多種資源,包括 EWG 的避免轉基因食品購物者指南、食品評分數據庫和 EWG 的健康生活應用程序,幫助消費者識別可能含有轉基因成分的食品。
美國農藥法規不完善
EWG 擔心農產品上的殺蟲劑,因為它們在設計上就有毒,專門用於殺死活生物體——被視為“害蟲”的昆蟲、植物和真菌。 但許多農藥也對人類健康構成威脅,包括癌症、激素干擾以及大腦和神經系統毒性。 這些危害已得到獨立科學家和醫生以及美國和國際政府機構的證實。
美國農業部和美國食品和藥物管理局發現的大多數農藥殘留量均低於政府限制並且是合法的。 但法律限制並不總是代表人類消費的安全。
傳統農業,甚至美國環保局,經常聲稱農藥是安全的,直到它們被禁止的那一刻起,因為大量證據表明它們對人類有毒。 毒死蜱就是一個很好的例子。
由於科學顯示對人類健康和野生動物構成威脅,許多在美國仍然合法使用的農藥已在歐盟被禁止。 四種有毒的新菸鹼類殺蟲劑——吡蟲啉、噻蟲嗪、噻蟲胺和呋蟲胺——在這裡仍然是合法使用的,儘管美國環保局已經承認它們對蜜蜂等昆蟲的危險。
EWG 大力倡導加強聯邦農藥法規。 EPA 的安全水平稱為“耐受性”,可幫助機構監管機構確定農民是否正確使用農藥。 如果設定耐受水平來保護所有食用農產品的兒童(我們認為應該這樣做),那麼更多的水果和蔬菜將會失敗。
我們還敦促美國農業部和美國食品和藥物管理局更定期地檢測所有商品的農藥殘留,並確保檢測農業中常用的所有農藥。 聯邦機構的農藥殘留監測和飲食調查未能充分了解美國人面臨的農藥暴露情況。
EWG 的《購物指南》通過分析 USDA 和 FDA 採集的 46,569 個樣本,對 46 種受歡迎的水果和蔬菜的農藥污染情況進行了排名。 美國農業部每年都會選擇這些水果和蔬菜的一部分進行測試,而不是每年測試所有作物。
為了創建本指南,EWG 使用每種食品最近一到兩年採樣期的數據。 由於美國農業部不測試哈密瓜,因此 EWG 使用 FDA 對該作物的農藥監測數據。
食品年份來源
蘋果 2015-2016 美國農業部 PDP
蘆筍 2017-2019 美國農業部 PDP
鱷梨 2012 年美國農業部 PDP
香蕉 2019-2020 美國農業部 PDP
甜椒和辣椒 2019-2021 美國農業部 PDP
藍莓 2020-2021 美國農業部 PDP
西蘭花 2020-2021 美國農業部 PDP
捲心菜 2017-2019 美國農業部 PDP
哈密瓜 2011-2012, 2019 美國農業部 PDP
胡蘿蔔 2020-2021 美國農業部 PDP
花椰菜 2019-2021 美國農業部 PDP
芹菜 2014, 2021 美國農業部 PDP
櫻桃 2014-2016 美國農業部 PDP
櫻桃番茄 2012 年美國農業部 PDP
黃瓜 2015-2017 美國農業部 PDP
茄子 2020-2021 美國農業部 PDP
葡萄柚 2015-2017 美國農業部 PDP
葡萄 2016 年美國農業部 PDP
綠豆 2020-2021 美國農業部 PDP
哈密瓜2008-2019 FDA
羽衣甘藍、羽衣甘藍和芥菜 2017-2020 美國農業部 PDP
新西蘭 2018-2020 FDA
生菜 2015-2017 美國農業部 PDP
芒果 2017-2018 美國農業部 PDP
蘑菇 2012-2013 美國農業部 PDP
油桃 2014-2015 美國農業部 PDP
洋蔥 2017 年美國農業部 PDP
橙子 2016 美國農業部 PDP
木瓜 2011-2012 美國農業部 PDP
2015 年、2021 年桃子 美國農業部 PDP
2016 年、2021 年梨 美國農業部 PDP
菠蘿 2002 年美國農業部 PDP
2013、2021 年李子 美國農業部 PDP
馬鈴薯 2016 年美國農業部 PDP
覆盆子 2013 美國農業部 PDP
豌豆 2017-2018 美國農業部 PDP
菠菜 2016 年美國農業部 PDP
草莓 2015-2016 美國農業部 PDP
夏南瓜 2020-2021 美國農業部 PDP
甜玉米 2014-2015 美國農業部 PDP
甜豌豆(冷凍)2018-2019 美國農業部 PDP
紅薯 2016-2018 美國農業部 PDP
橘子 2019-2021 美國農業部 PDP
西紅柿 2015-2016 美國農業部 PDP
西瓜 2015 年、2021 年美國農業部 PDP
冬南瓜 2020-2021 美國農業部 PDP
進行測試之前,美國農業部會按照人們在家中處理的方式處理每塊水果或蔬菜。 例如,不可食用的果皮去皮,可食用的果皮用冷水沖洗並瀝乾後再進行測試。 因此,美國農業部的測試結果很好地表明了消費者可能的接觸情況。
加州農藥監管部的測試結果表明,未經加工的產品往往含有較高濃度的農藥。
為了比較食品,EWG 考慮了農藥污染的六種衡量標準:
檢測出含有可檢測農藥的樣品百分比
含有兩種或多種可檢測農藥的樣品百分比
單個樣品中發現的農藥平均數量
發現的農藥平均含量(百萬分之一)
單個樣品中發現的農藥最大數量
農作物上發現的農藥總數。
在每個類別中,我們對 46 種水果和蔬菜進行了排名,然後將排名標準化為 1 到 100,其中 100 為最高。 對於每種食物,我們通過將每個指標的標準化排名相加來計算總分。 所有類別的權重相同,因為它們傳達了有關農產品農藥含量的不同但同樣相關的信息。
美國農業部的測試計劃包括國內種植的和進口的產品,有時排名會根據原產地而有所不同。 在這些情況下,我們分別展示國產和進口商品,以幫助消費者選擇農藥含量最低的選項。
《農產品農藥購物指南》完整列表顯示了水果和蔬菜根據這些總分的排名。
購物指南未將風險評估納入計算中。 所有農藥的權重均等,我們不考慮 EPA 認為可接受的水平。 研究不斷為農藥對人類和環境健康造成的威脅提供新的見解。 EWG 設計這種方法是為了捕捉這種不確定性,並使消費者能夠減少總體農藥用量。
本文根據 2021 年購物指南改編和更新。
Trust God, not sinful people. Worship God, but not things/people. Let God lead you, but not let others lead you. 相信上帝,而不是有罪的人。 敬拜神,而不是事/人。 讓上帝帶領你,但不要讓別人帶領你。